If you're looking to elevate your social media game, you might have received an email from us with a report on your social media performance. If not, and you've found your way here, read on to learn how to conduct your own social media analysis using Semrush Social Tracker.
The monthly report highlights your most popular social network—where you contribute the most, create the greatest impact, and experience the fastest growth.
This data is automatically generated by the tool based on your domain, and the precise details can be found in the Social Tracker:
- Audience, activity, engagement, and hashtags
- Trends and top posts
- Audience growth across competing brands
Monitor your own and your competitors' X, Facebook, Instagram (Business accounts), YouTube, and Pinterest profiles.
Now, let’s dive into your report:
Social Performance
This data is based on your engagement metrics and how they have changed over the past month.
- Low: A decline in engagement of more than 10% compared to the previous month.
- Good: Engagement changes within the range of -9% to +9%.
- Great: An increase in engagement of more than 10%.
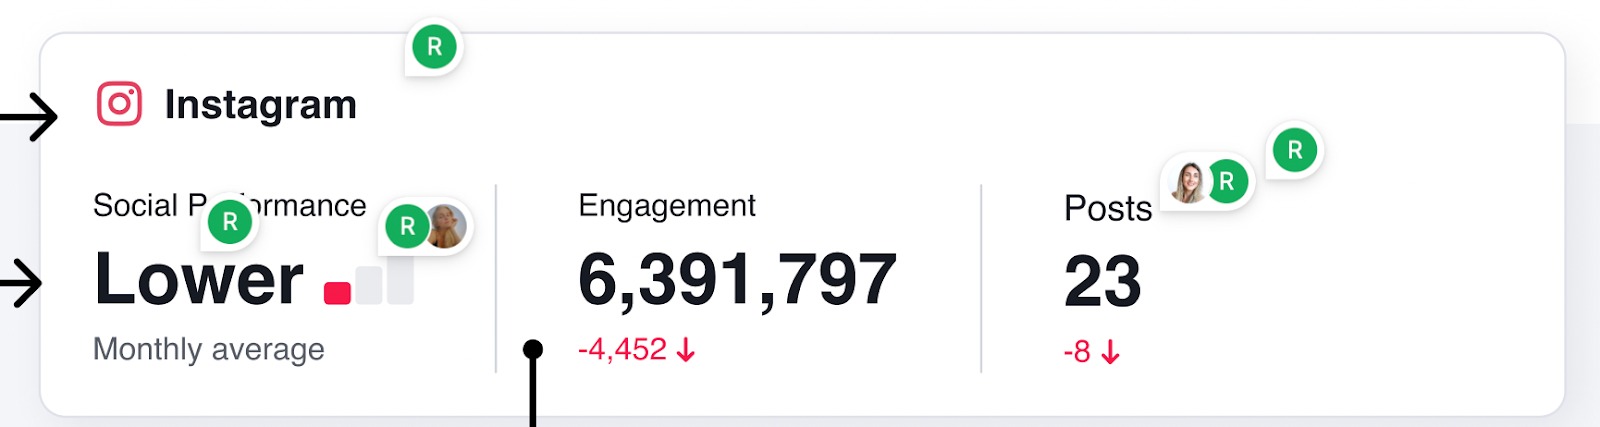
Engagement reflects how many people interacted with your posts. It’s the total sum of shares, likes, reactions (such as "wow," "sad," "angry," etc.), and comments made on all posts in the last month.
Posts represent the number of posts you published on this social network in the last month.
How do you put this data to work?
Monitoring the number of posts helps you understand your content output and adjust your posting strategy:
- If engagement is high but posting frequency is low, consider increasing your output to further boost interaction.
- On the other hand, if you are posting frequently but engagement remains low, it might be time to reevaluate your content quality or posting times.
You can also benchmark your performance against competitors:
- With Social Tracker, you can compare posting frequency, engagement rates, and other key metrics to see how you measure up in your industry.
- Identify the best time to post with Semrush Analytics (Audience tab): see the breakdown of your followers by country, gender, age, and the time they are most active.
Growth Indicators
The Growth Indicators section highlights which social network has the most interactions with your posts among all social media channels. It also shows the total number of likes your posts received on that network in the past month.
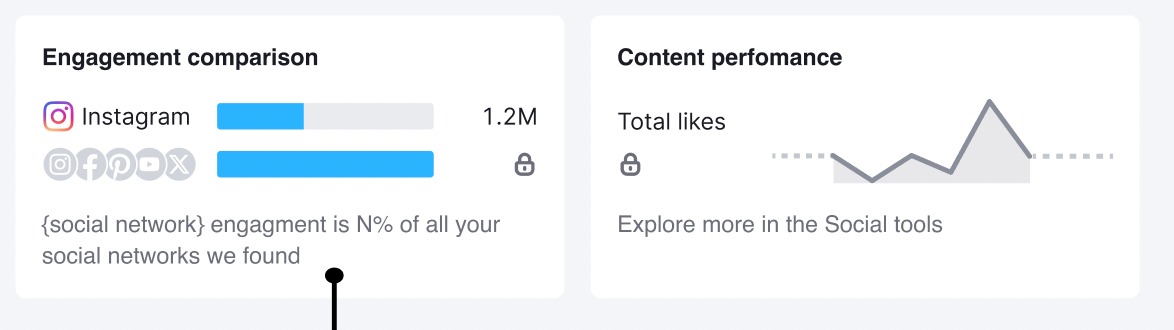
Engagement comparison: How do you put this data to work?
You’re already experiencing growth in engagement on this social network—that’s great!
This indicates that your content resonates with your audience here, so it’s a perfect time to capitalize on that momentum. Focus on what’s working by continuing to post content that drives interactions, and consider increasing your posting frequency or experimenting with new formats like videos or polls to further enhance engagement.
To understand how to grow your other platforms, explore competitor strategies using Social Tracker—analyze:
- The types of content they post
- The times they post
- What engages their audience.
Content performance: How do you put this data to work?
- Go to Social Tracker: Start by reviewing your social media performance and competitor data.
- Check your top competitor’s posting frequency: Look at how many posts they publish on average per month and per day. Benchmark this against your own posting frequency to determine if you need to post more or less.
- Review engagement per post: Analyze which types of posts (videos, polls, images) drive the most engagement for both you and your competitors. This will help you identify the most effective content formats.
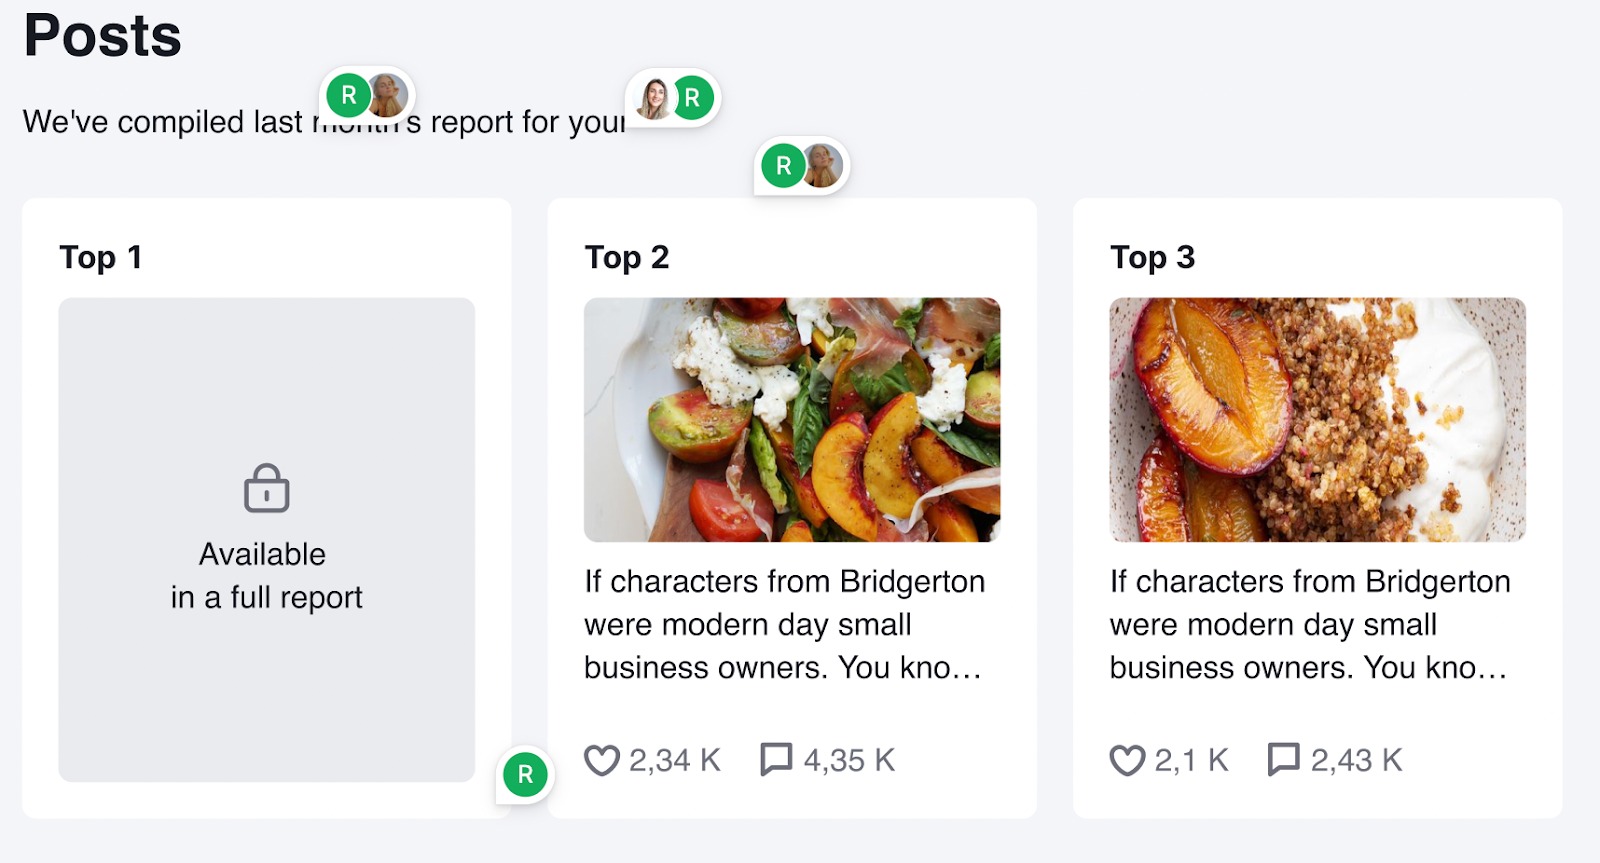
Top Posts
In the Top Posts section, you can see your most engaging posts over the last month, with the number of likes and comments.
How do you put this data to work?
From here, you can identify which content receives the most audience interaction and gather ideas on how to adjust your future content strategy.
To dive deeper:
- Add your competitors in Social Tracker: Review their top posts published during the selected time frame. Identify the most effective content ideas and formats.
- Analyze hashtags: Look at the hashtags you used in your top-performing posts. Identify the most successful ones and consider incorporating them into future content.
Schedule posts: Using these insights, you can create your ideal content calendar and schedule posts directly in Social Poster.